Unlock Version
Lock Version
Changelog for QGIS 3.8

Release date: 21 June, 2019
QGIS 3.8 brings an extensive list of new changes and a lot of polishing of existing features - the highlights of which we will try to cover here. As always can we remind you that QGIS is an open source project and if you are able to, consider supporting our work through donations, sponsorship or contributions to the code documentation, web site and so on.
Thanks
We would like to thank the developers, documenters, testers and all the many folks out there who volunteer their time and effort (or fund people to do so). From the QGIS community we hope you enjoy this release! If you wish to donate time, money or otherwise get involved in making QGIS more awesome, please wander along to qgis.org and lend a hand!
QGIS is supported by donors and sponsors. A current list of donors who have made financial contributions large and small to the project can be seen on our donors list. If you would like to become an official project sponsor, please visit our sponsorship page for details. Sponsoring QGIS helps us to fund our six monthly developer meetings, maintain project infrastructure and fund bug fixing efforts. A complete list of current sponsors is provided below - our very great thank you to all of our sponsors!
QGIS is Free software and you are under no obligation to pay anything to use it - in fact we want to encourage people far and wide to use it regardless of what your financial or social status is - we believe empowering people with spatial decision making tools will result in a better society for all of humanity.
Processing
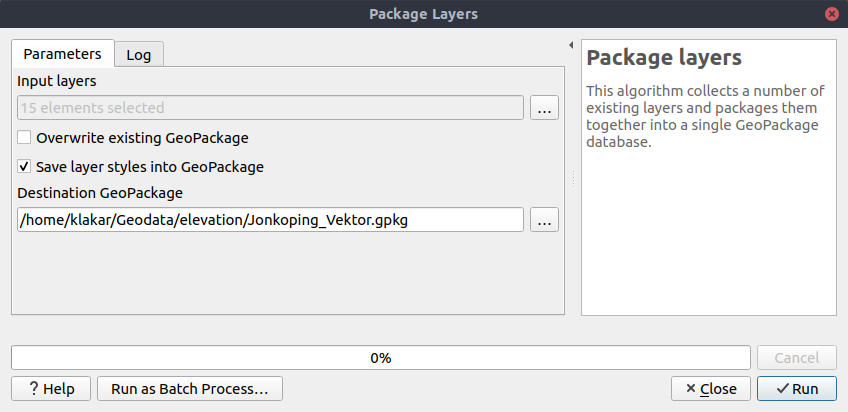
QGIS loves GeoPackage, so it's likely no surprise that every new QGIS version brings improvements to GeoPackage handling! In 3.8, we enhanced the "Package Layers" Processing algorithm so that it now allows embedding the current layer styles directly into the packaged layers!
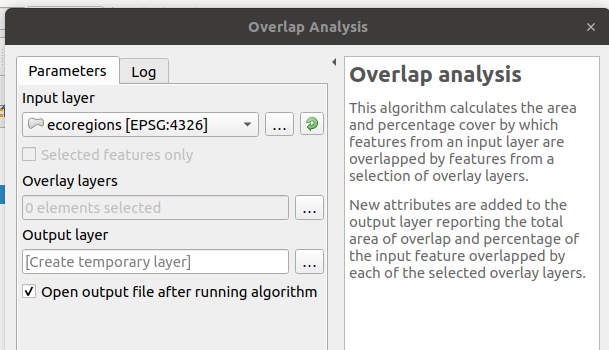
This new Processing algorithm calculates the area and percentage cover by which features from an input layer are overlapped by features from a selection of overlay layers. New attributes are added to the output layer reporting the total area of overlap and percentage of the input feature overlapped by each of the selected overlay layers.
This is quite a common GIS task request, yet is full of traps for inexperienced users, and the amount of manual data work usually done by users to calculate these figures can often lead to mistakes and inaccurate results. We want to make spatial analysis as easy and foolproof as possible, so we've added Overlap Analysis as an inbuilt tool which allows this task to be done in a single step without risk of human error.
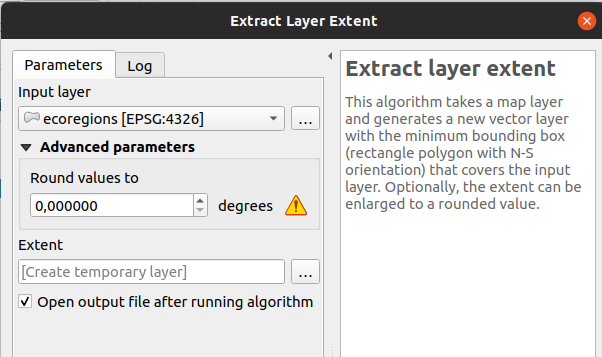
We've added a parameter to the Processing algorithm 'Extract Layer Extent' to round the extent bounding box coordinates to a certain interval. While rounding, the bounding box will only ever be enlarged, to ensure it will always cover the input data set. (I.e. the x and y minimum coordinates are rounded down, and x and y maximum coordinates are rounded up).
This feature was developed by Raymond Nijssen
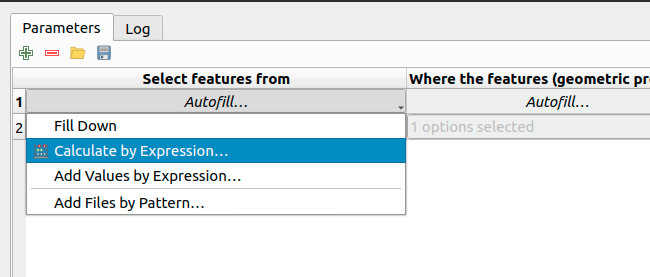
In QGIS 3.8 we moved the existing "double click column header" to fill values down functionality to a new "Auto fill" button in the Processing Batch dialog, making this feature much more user-discoverable (we suspect many users had no idea this handy shortcut even existed!). In addition, we've added TONS of new functionality to easily auto-populate the batch table. These include:
- File or layer parameters can now be batch populated by searching for files in a directory with a matching filename pattern (including recursive searches!). Ever needed to auto convert 100s of Shapefiles from a set of folders? Now it's easy to do!
- An option to add calculated values from a QGIS expression, allowing complex range-based values to be added to the dialog (e.g. values from 100-1000, increasing by 50)
- A "Calculate by Expression" option allows for updating existing batch table cells using the results of a QGIS expression. These expressions can freely utilise other parameter values from the input batch rows, making it easy to craft the exact output file name you desire based on the other columns values in a batch row.
We've added a brand-new algorithm to generate raster "XYZ" tiles using the current QGIS project. Tile images can be saved as individual images in directory structure, or as a single file in the "MBTiles" format.
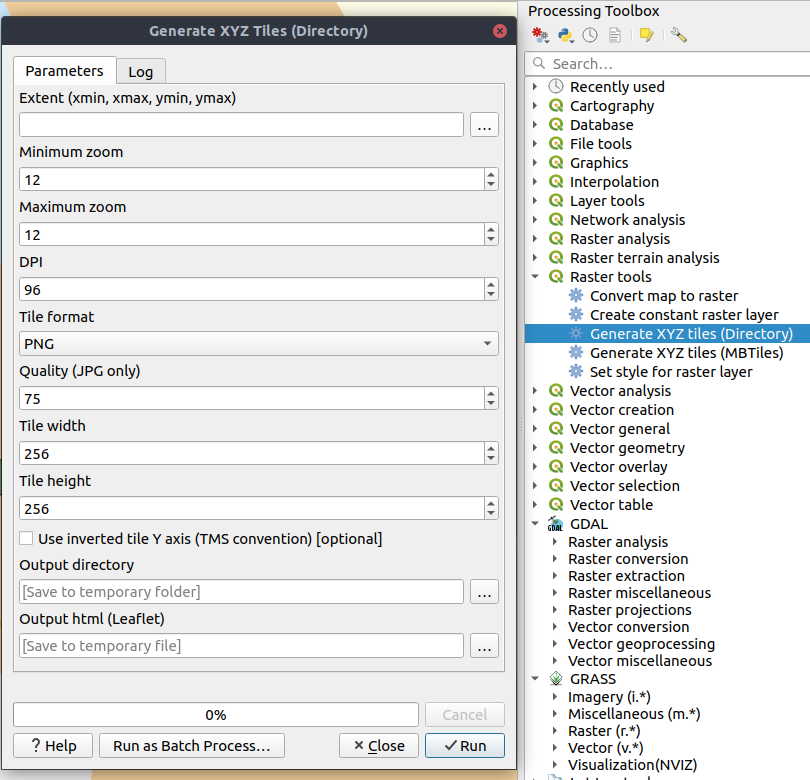
This feature was funded by Hansestadt Herford, SWK mbH, Datenbankgesellschaft mbH
This feature was developed by Lutra Consulting
QGIS 3.8 brings back the OTB Processing provider, which was removed in the QGIS 3.0 update. The provider was updated to use all the new goodies which are available in Processing in QGIS 3, and is once again available out-of-the-box for all your imagery analysis requirements!
(Note that OTB is a third party dependency which must be manually installed by users. Instructions on installing OTB are available here)
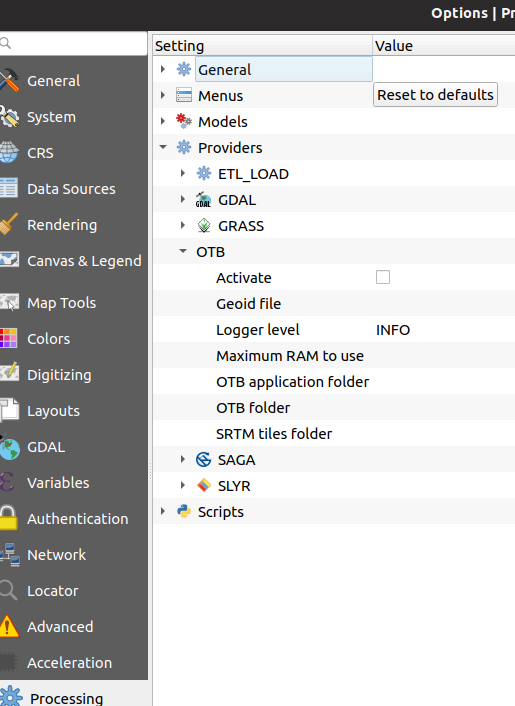
This feature was developed by Rashad Kanavath
We've added a new "Model Variables" dock panel to the model editor, allowing you to create and set custom expression variables for use in your Processing models. These variables are available anywhere expressions are evaluated within the model, so you can use them as input parameter values for child algorithms, within data-defined dynamic parameters, etc.
The prime use case here is for models which use a constant value throughout multiple steps within the model (e.g. @target_resolution: a target raster resolution, @max_simplification: a simplification value for input features coming from different sources, etc). Previously, you'd need to hunt down and replace these values in multiple places when you wanted to tweak them. By replacing them with variables in your model you only have a single place you need to edit these values when you want to adjust them!
Model variables are stored within an individual Processing model itself, and are not exposed outside of the model designer dialog.
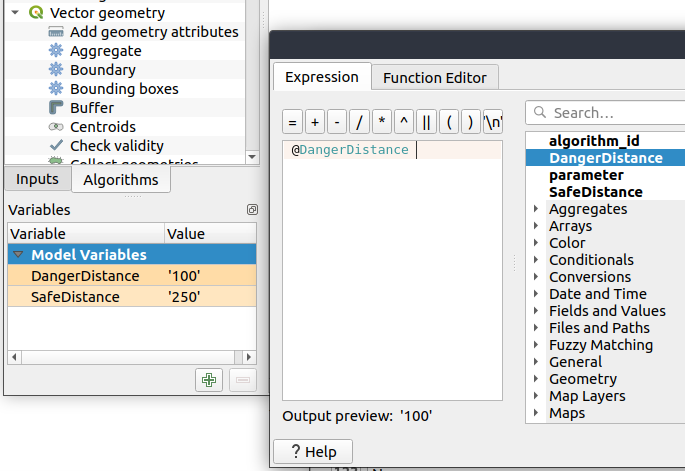
We've added numerous usability improvements to the Processing Graphical Modeler, including
- The addition of helpful tooltips when hovering over model components
- Algorithms and inputs connected to model components are highlighted as you hover the mouse over different parts of the model, making it much easier to visualise the model flow and connections inside complex models
- Input parameter types are now shown in the title of the parameter definition dialog
- The data type for numeric parameters may now be specified, allowing for integer-only inputs for models
By default, we now hide 3rd party algorithms with known issues from the Processing toolbox, helping you avoid frustration (or misleading results) when running these algorithms. A new setting in the Processing options screen allows these algorithms to be shown, but they will be highlighted in the toolbox with a warning icon. Use at your own risk!
In version 3.8 we've added new algorithms which calculate the boolean OR or AND for a set of input rasters. For AND, if all of the input rasters have a non-zero value for a pixel, that pixel will be set to 1 in the output raster, otherwise it will be set to 0. For OR, if ANY of the input rasters have a non-zero value for a pixel, that pixel will be set to 1 in the output raster, else 0.
A reference layer parameter allows you to specify an existing raster layer to use as a reference when creating the output raster. The output raster will have the same extent, CRS, and pixel dimensions as this layer.
By default, a nodata pixel in ANY of the input layers will result in a nodata pixel in the output raster. If you check the 'Treat nodata values as false' option, then nodata inputs will be treated the same as a 0 input value.
These new algorithms make for much simpler raster boolean logic calculation, without the complexity of using the raster calculator. They are also dynamically scalable to any number of input rasters (unlike the raster calculator), so are much more flexible when used within your Processing models.
By adding new parameter types for Print Layouts and Print Layout items, we've opened up QGIS 3.8 to a whole new world of Processing algorithms which operate on print layouts. These new parameter types allow for creation of Processing algorithms and graphical models which prompt users to select a print layout and/or an item on the layout when run.
We've added a new parameter type specifically for map scales, QgsProcessingParameterScale. Scale values are evaluated using self.parameterAsDouble, which return the map scale denominator (matching the standard in other parts of the QGIS API).
Scale parameters are displayed to users using the standard QgsScaleWidget, which includes the combo box of predefined scales and a shortcut button to match the current map scale. The addition of this new parameter type allows you to create Processing algorithms and models which require a scale choice at run time.
We improved the workflow for algorithms with a "point" input parameter. When picking the point coordinate from a map you can now take advantage of QGIS snapping tools, allowing you to exactly match the point parameter to a feature's boundary.
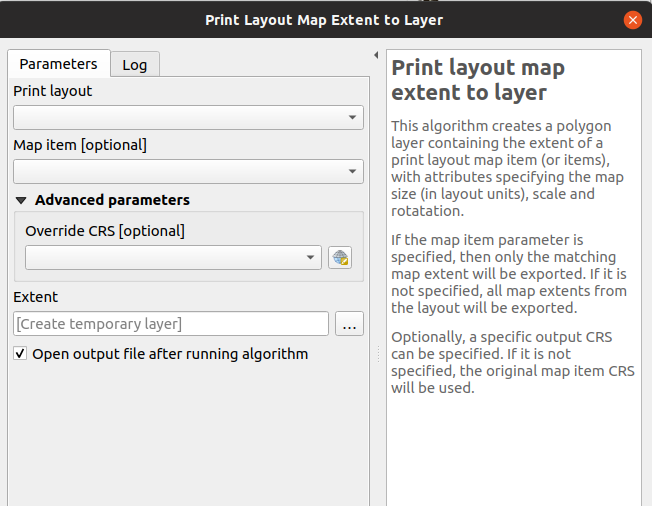
Taking advantage of the new facilities for accessing Print Layouts in Processing, we added a new algorithm which creates a polygon layer containing the extent of a print layout map item. The output layer also includes handy attributes specifying the map size (in layout units), scale and rotation.
If you've ever wanted to create an advanced overview indicator, and the inbuilt layout tools haven't sufficed — this new algorithm is for you!
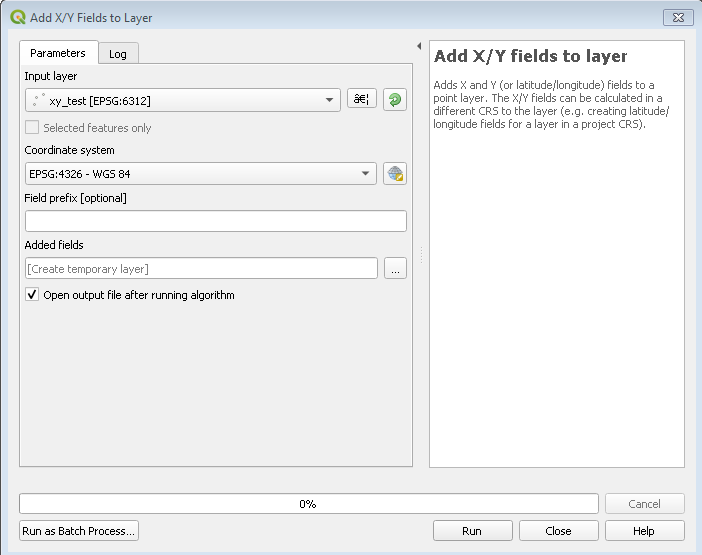
This new algorithm is a handy shortcut for adding X and Y (or latitude/longitude) fields to a point layer. You can even calculate the X/Y values using a different coordinate reference system from the layer (e.g. creating latitude/longitude fields for a layer in a projected CRS).
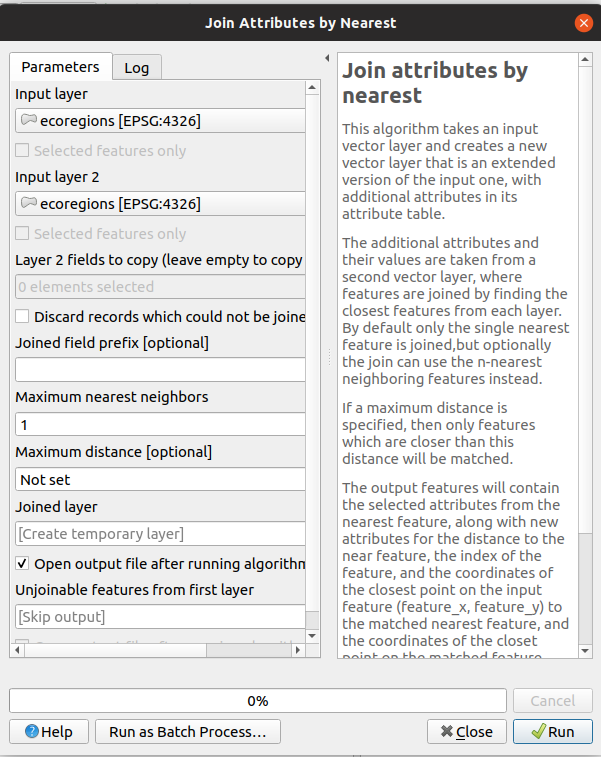
You can now perform K-nearest neighbour joins from the Processing toolbox!
QGIS 3.8 brings a new algorithm which takes an input vector layer and creates a new vector layer with additional attributes in its attribute table. The additional attributes and their values are taken from a second vector layer, where features are joined by finding the closest features from each layer.
By default only the single nearest feature is joined, but optionally the join can use the n-nearest neighboring features instead. If a maximum distance is specified, then only features which are closer than this distance will be matched.
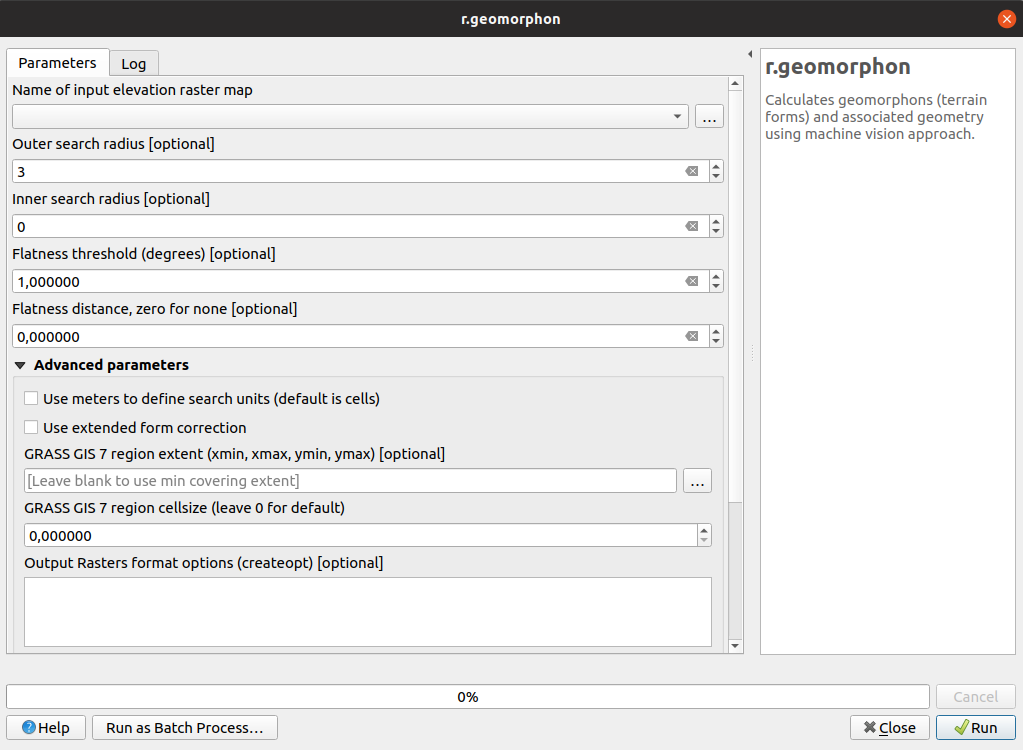
The upstream GRASS team has been hard at work creating a new GRASS module for terrain analysis — "r.geomorphon". In 3.8 we expose their efforts via a new Processing tool, which calculates geomorphons (terrain forms) and associated geometry using a machine learning approach.
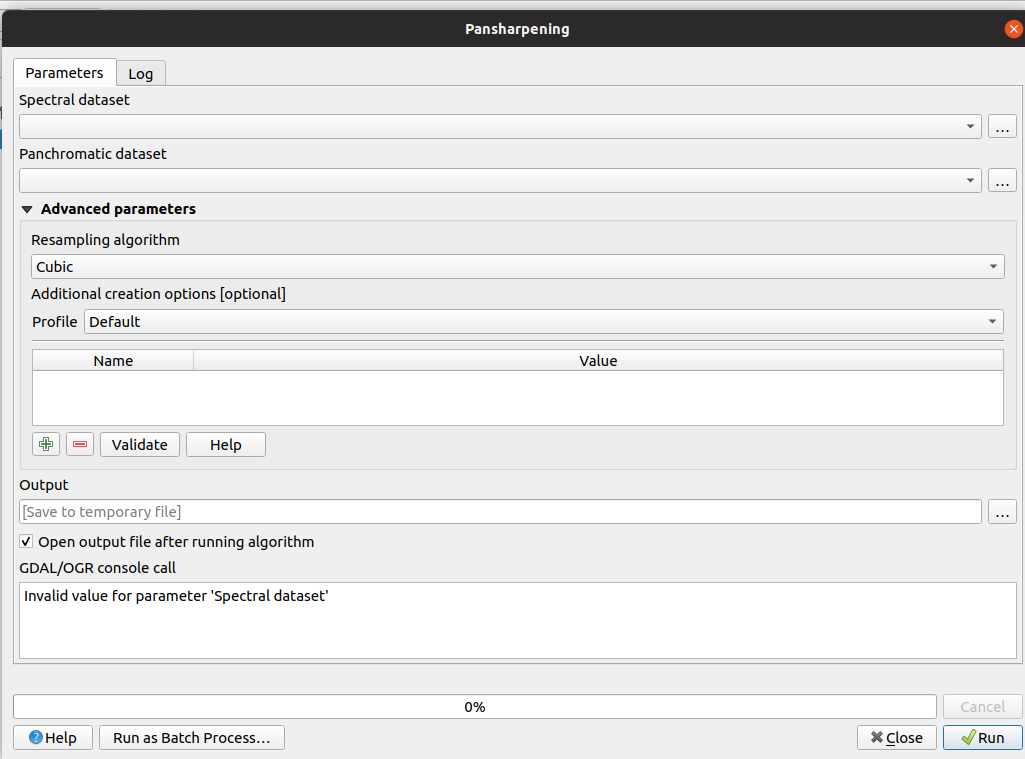
Another third party tool which we've added to the Processing toolbox in QGIS 3.8 is the GDAL pansharpening tool. Now it's easy to take advantage of this fast, powerful tool in your Processing analysis scripts and models.
This feature was developed by Alexander Bruy
We've added overlay layer fields prefix parameter for the following algorithms:
- intersection algorithm
- line intersection algorithm
- symmetrical difference algorithm
- union algorithm
This can come in very handy to avoid arbitrary colliding field renaming when merging layers.
This feature was developed by Mathieu Pellerin
Import PR from Github into Entries