
Animating time series data
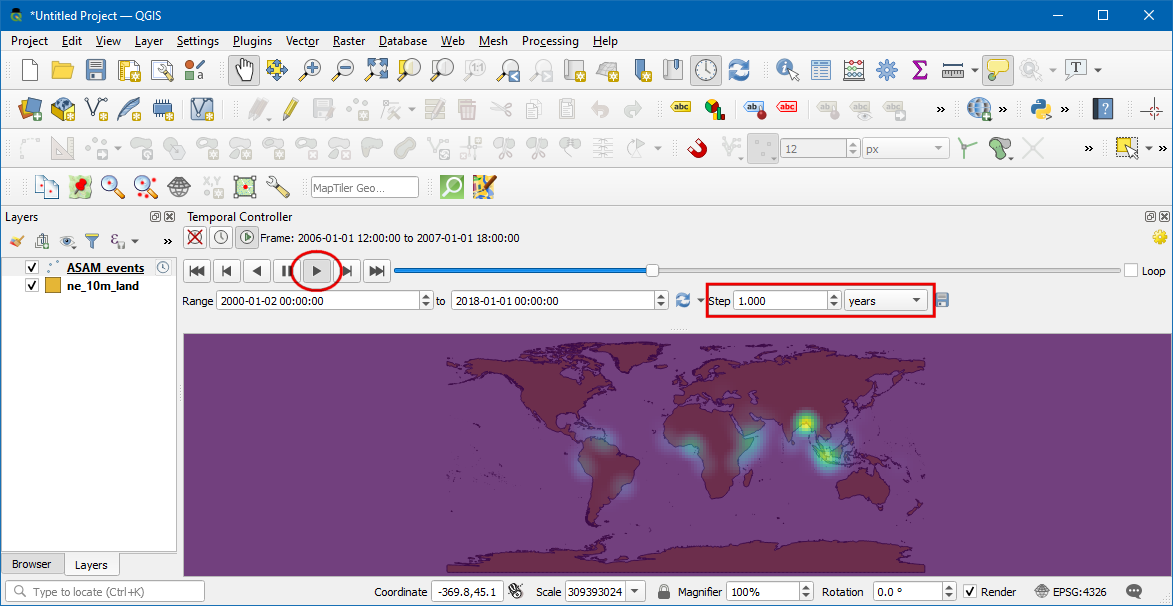
“In this module we give you walk through of visualising time series data in QGIS”
Time series is a sequence of values collected overtime on a particular variable. A time series can consist of the values of a variable observed at discrete times, averaged over a given time interval, or recorded continuously with time.
Time series can be analyzed to
a) detect a trend due to another random variable
b) develop and calibrate a model,
c) predict future characteristics of a variable.
The exercise can be fetched here