Project: QGIS
Version: 3.4 LTR
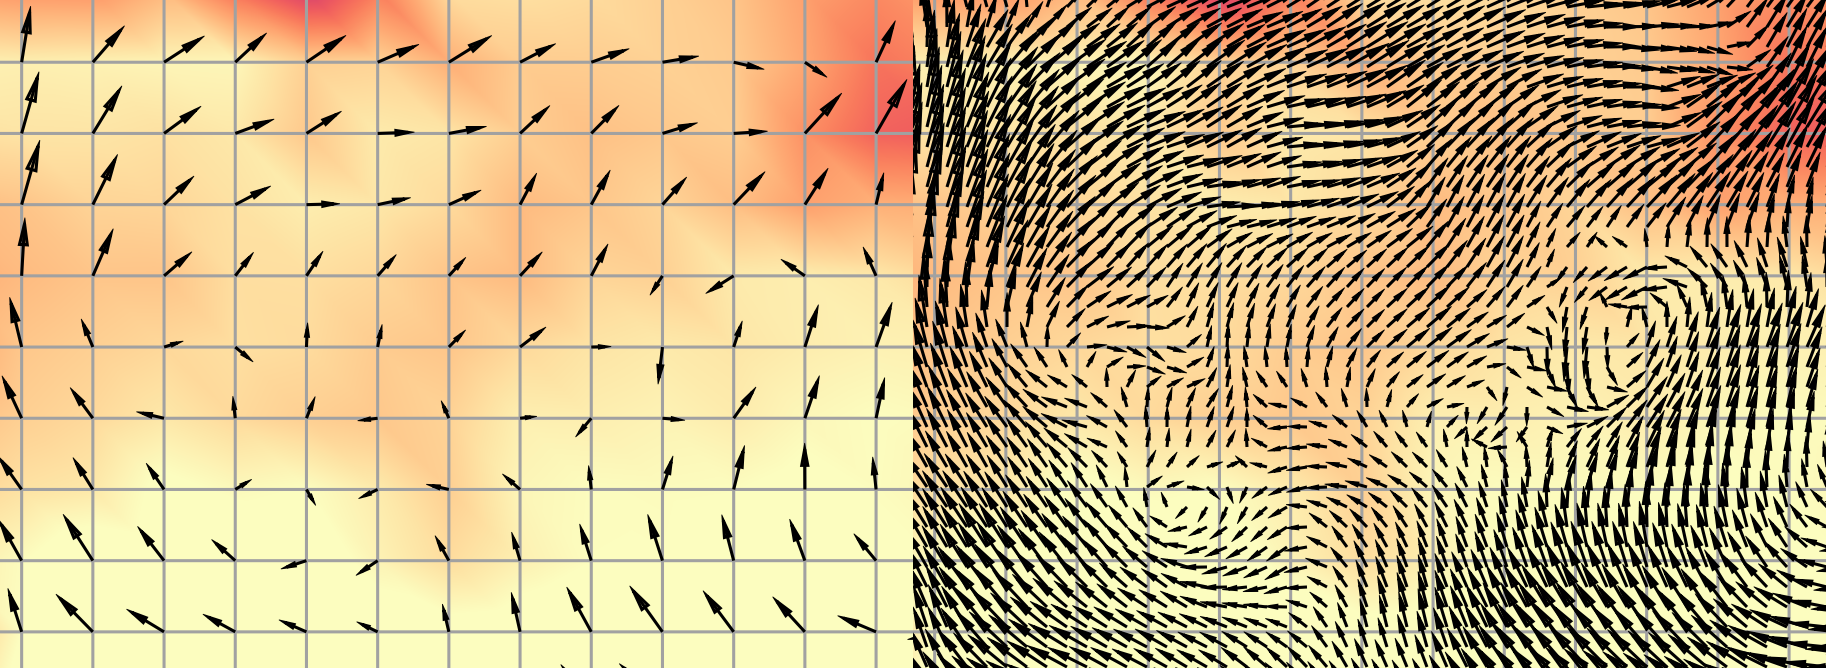
Scalar data are generated usually at the centre/corner of each mesh element. When displaying the scalar data, the arrows might look sparse and often not possible to see the general trend. With this option, arrows can be displayed on a user-defined grid. Extra scalar values will be interpolated on-the-fly and placed on the use-defined grid.