
Project: QGIS
Changelog for version: 3.40

The QGIS Project is thrilled to announce the release of QGIS 3.40, refining the platform's capabilities for geospatial professionals and enthusiasts alike and underscoring the commitment to empower its users with groundbreaking tools for spatial discovery.
This release incorporates major strides in color management functionality, as described in QEP283, with the introduction of CMYK color support and the definition of International Color Consortium (ICC) color profiles for use in widgets, expressions, and cartography-oriented workflows to ensure accurate color representation across different media types.
Additionally, QGIS now includes native integration with STAC data sources for easier access to remote data sources through the QGIS browser. New functionality allows for the storing of custom PyQGIS Expressions and methods directly within project files, providing users with greater flexibility in their data-handling processes. This functionality will also provide new opportunities for improved automation capabilities and is sure to boost productivity and facilitate more seamless collaboration for teams.
This release also includes a wealth of other new features that include improvements to Labeling, 3D views, Networking, Attribute tables, and many others.
For a whirlwind tour of all the new functionalities introduced, you can view the highlight reel video on YouTube.
QGIS is a community effort, and we would like to extend a big thank you to the developers, documenters, testers, and the many folks out there who volunteer their time and effort (or fund people to do so) to make these releases possible. From the QGIS community, we hope you enjoy this release! If you wish to donate time, money, or otherwise contribute towards making QGIS more awesome, please wander along to QGIS.ORG and lend a hand!
QGIS is supported by donors and sustaining members. A current list of donors who have made financial contributions large or small to the project can be seen on our list of donors. If you would like to become an official project sustaining member, please visit our sustaining member page for more details. Sponsoring QGIS helps us to fund our regular developer meetings, maintain project infrastructure, and fund bug-fixing efforts. A complete list of current sponsors is provided below - our very big thank you to all of our sponsors!
QGIS is free software and you are under no obligation to pay anything to use it - in fact, we want to encourage people far and wide to use it regardless of their financial or social status - we believe that empowering people with spatial decision-making tools will result in a better society for all of humanity.
Map Tools
When a vector layer and the project have vertical datums present, and they differ, then include the transformed Z value for the identified features in the project's datum too.
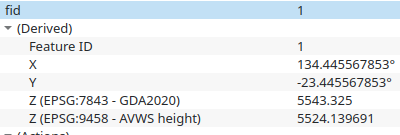
This feature was developed by Nyall Dawson
In previous releases of QGIS, only referenced relations (related features the current feature is pointing to) were presented to users when exploring a feature with the info tool. Support for presenting referencing relations (related features the current feature is referenced by), and they are now supported on an arbitrary nesting level.
In addition, multiple updates to the handling of related features in the identify tool have been added, including:
- prevention of duplicate relation references
- load relations only on the unfolding of a node (preventing an 'explosion' of loading related references)
- control toggle to enable or disable relation references
- a contextual menu item for "Identify Feature" to load a nested related feature into the root of the identify tool context
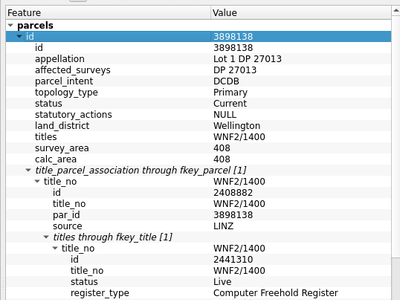
This feature was developed by Even Rouault
User Interface
A new option in the Data Sources tab of the Options Dialog (opened via the Settings menu) will configure QGIS to always resize the columns of an attribute table to fit the contents when it is opened.
This feature was developed by Ben Wirf
A duplicate button has been added to the actions dialogue on layer properties.
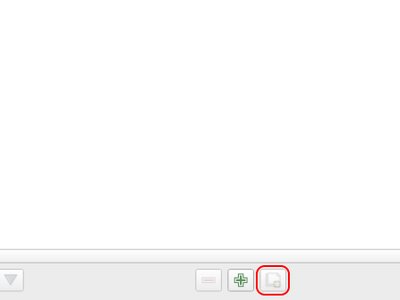
This feature was developed by Speedrace4
Symbology
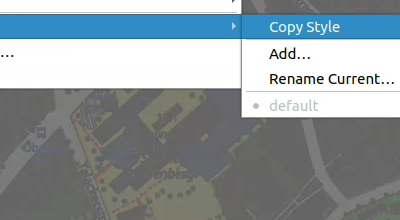
QGIS now supports categories for copying properties and styles between raster layers (instead of simply forcing the use of AllStyleCategories as before), and now includes raster data categories for:
LayerConfigurationTemporalElevationMapTipsNotesCustomPropertiesSymbologyRendering
In addition, these styles are supported in the import and export functionalities of the QML/SLD layer definition and style files, making raster layer management more consistent with the user experience for vector layers.
This feature was developed by signedav
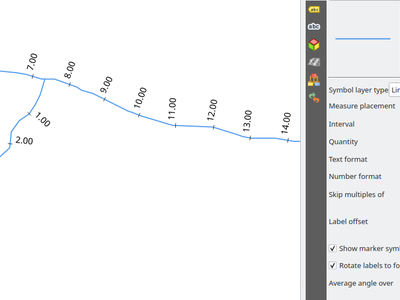
This new symbol layer type allows placing text labels at regular intervals along a line (or at positions corresponding to existing vertices). Positions can be calculated using Cartesian distances, or interpolated from z/m values.
Functionality includes:
- Labels can be placed using fixed cartesian 2d distances, at regular linearly interpolated spacing calculated using the Z or M values in geometries, or at existing vertices
- Labels can show either the running total distance, or the linearly interpolated Z/M value
- Uses text renderer to draw labels, so the full range of functionality is available for the labels (including buffers, shadows, etc)
- Uses the QGIS numeric format classes to format numbers as strings, so users have full range of customisation options for eg decimal places
- An optional "skip multiples of" setting. If set, then labels which are a multiple of this value will be skipped over. This allows construction of complex referencing labels, eg where a symbol has two linear referencing symbol layers, one set to label every 100m in a small font, skipping multiples of 1000, and a second set to label every 1000m in a big bold font
- Labels are rendered using an angle calculated by averaging the linestring, so sharp tiny jaggies don't result in unslightly label rotation
- Optionally, markers can be placed at referenced points in the line string, using a full QGIS marker symbol (this allows eg showing a cross-hatch at the labeled point, for a "ruler" style line)
- Data defined control over the placement intervals, skip multiples setting, marker visibility and average angle calculation length
Notes:
- When using the distance-based placement or labels, the distances are calculated using 2D only, Cartesian calculations based on the original layer CRS. This could potentially be extended in future to expose options for 3D Cartesian distances, or ellipsoidal distance calculations.
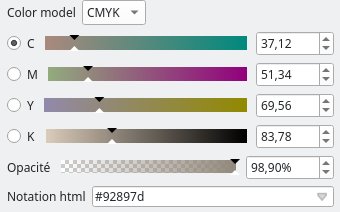
Color previews of CMYK colors will display the color value using a list of float values
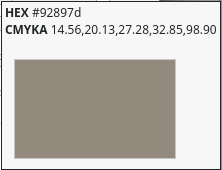
The QGIS Color Widget now supports the selection of the color component as a float value with 2 decimals
Allows rendering a marker symbol below the endpoint of the balloon callout. Designed to allow balloon callouts to reproduce the same visual appearance as the older annotation framework items.
This feature was developed by Nyall Dawson
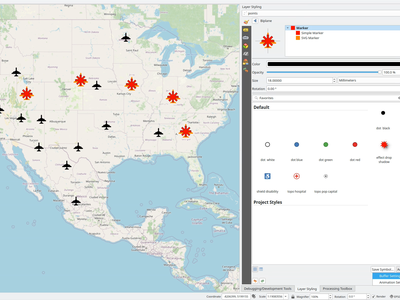
QGIS now includes "buffers" for marker symbols. Just like label buffers, marker buffers are a halo effect around marker symbols designed to make the symbol more readable against different backgrounds.
Buffers are defined on a symbol level (not per symbol-layer), and are calculated and drawn using the shape of ALL the symbol layers in the marker. This makes them super-easy to configure, as getting the same result by hand would require many duplicate symbol layers and duplicate settings across these!
This change is designed to plug on of the (very few!) remaining large symbology gaps between ArcMap and QGIS, where ArcMap has had support for solid color marker "halos" for decades.
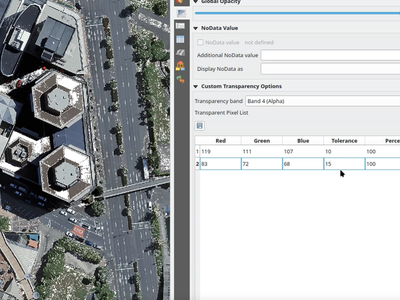
Allows pixels with color components just outside of the specified RGB values to also be treated as transparent pixels
Useful for photographs or compressed rasters where a range of color values must be made transparent.
Annotations
In line with QEP#269, any of the old SVG and text annotations will automatically be converted to the newer picture and rectangular text annotation item types when loading an old project.
Actions for creating new SVG and text annotations using the old annotation framework will be removed, requiring users to use the corresponding annotation items instead.
This feature was developed by Nyall Dawson
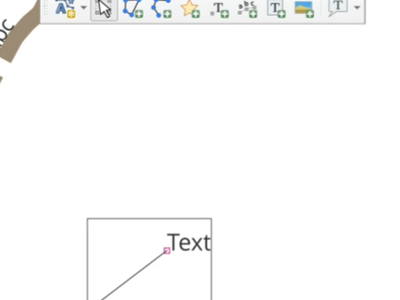
Allows creating of callout lines (or bubble callouts) which link the text to a map location. To create a callout, users select the text item and then drag out the central x node to the desired callout end point.
Callout styles can be modified through the layer styling panel.
This feature was developed by Nyall Dawson
In line with QEP#269, a new "Linked layer" setting has been added to the render page for annotation layers. This allows users to optionally set a linked visibility layer for the annotation layer. If set, then the annotations will only be drawn when the linked layer is visible on the map.
This feature was developed by Nyall Dawson
In line with QEP#269, a "text inside rectangle" annotation item type has been added
This feature was developed by Nyall Dawson
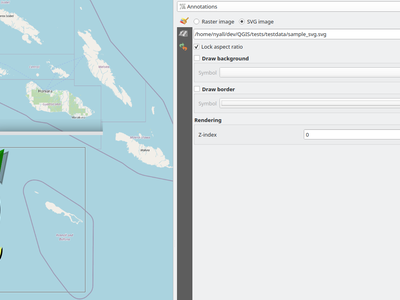
Can render SVG or raster images as items in an annotation layer. Options are present for:
- Locking the picture's aspect ratio
- Drawing with a background symbol
- Drawing with a border symbol
- Linked or embedded pictures
- Rendering with scale dependent sizes or fixed sizes
This feature was developed by Nyall Dawson
Labelling
For multi-line labels, this allows use of either:
- HTML
attributes
- CSS "text-align: xxx"
- HTML
some text tags
Supported alignments are left, right, center and justify
Horizontal alignment can be used in all contexts where HTML text is rendered, EXCEPT for curved labels (since they are restricted to single-line text)
Support for header tags (h1/h2/.../h6) and associated formatting in HTML labels is now supported.
Support for word-spacing CSS in html labels and other places HTML text formatting is accepted has been added to QGISm allowing the use of CSS rules such as "word-spacing: 12" to increase the word spacing in a section of HTML text. The word spacing is always treated as being in point units.
In line with QEP#299, a new API framework has been implemented for setting advanced labeling engine rules on a project, and implements 4 initial rule types:
- QgsLabelingEngineRuleMinimumDistanceLabelToFeature: prevents labels being placed too close to features from a different layer
- QgsLabelingEngineRuleMaximumDistanceLabelToFeature: prevents labels being placed too far from features from a different layer
- QgsLabelingEngineRuleMinimumDistanceLabelToLabel: prevents labels being placed too close to labels from a different layer
- QgsLabelingEngineRuleAvoidLabelOverlapWithFeature: prevents labels being placed overlapping features from a different layer
Note that the first 3 rules require a build based on GEOS >= 3.10, and they are not available for older GEOS builds.
Also implemented is a registry for storing available rule classes, and serialization of rules and configuration in QGIS projects.
Allows use of img tags in HTML label content. The following logic is applied:
- Image path is set via the src="xxx" attribute. Local, HTTP, and base64 encoded paths are permitted
- Any image format readable by QGIS can be used
- Image sizes can be specified via the width="##" and height="##" attributes. If width or height is not specified it will automatically be calculated from the original image size
- If width or height are specified, they are considered to be in POINTS
- The css width/height settings are NOT respected (this is a Qt limitation)
- Images are not supported for curved text labels
- Images are placed inline only, floating images are not supported
Diagrams
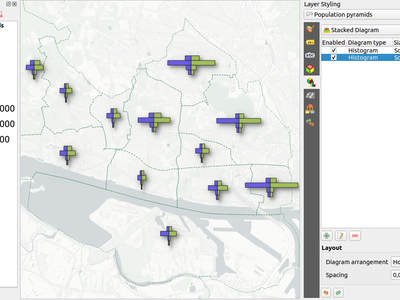
Stacked diagrams provide a method of structuring multiple adjacent (horizontally or vertically) stacked "Sub Diagrams" for a single feature, providing a method for creating complex diagram objects such as population pyramids.
The implementation introduces multiple new settings for stacked diagram and sub-diagram configuration, and has migrated the diagram settings modal dialog to the Styling dock widget.
This feature was funded by Landesamt für Vermessung und Geoinformation (LVG) Vorarlberg in collaboration with the QGIS user group Switzerland.
This feature was developed by Germán Carrillo
Mesh
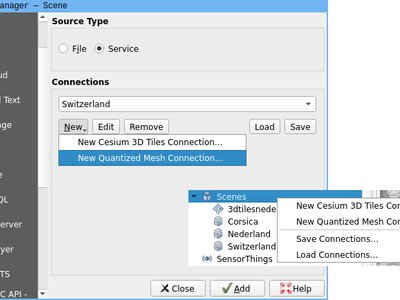
New GUI elements are provided for loading Quantized Mesh data sources and layers in the QGIS Browser panel as well as the data source manager.
Rendering
QGIS capabilities have been extended for loading vector tiles that include multiple sources/ URLs within a single style definition.
This feature was developed by Denis Rouzaud
3D Features
Vertical CRS configuration at the layer level will be respected in 3D map views provided that the project has a non-geographic 2D CRS set and a vertical CRS set.
Note that this will only affect newly created 3D map views and no setting is currently exposed for users to modify the CRS for existing 3D map views.
This feature was developed by Nyall Dawson
A new option for setting gl_clipistance on 3D views will appropriately filter feature vertices that fall outside of the designated extent, effectively cropping the view on multiple planes.
This setting is controlled with the enableClipping() and disableClipping() methods on Qgs3DMapScene objects.
This feature was developed by Jean Felder
Print Layouts
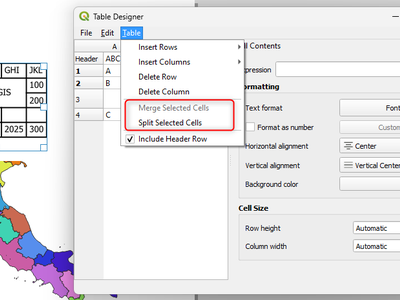
Allows adjacent cells to be merged in layout manual table items.
From the table editor, select multiple cells in a rectangular shape and then from the Table menu, click "Merge Selected Cells". Merged cells can be un-merged via the "Split Selected Cells" menu action.
In line with QEP#283, QGIS will generate a valid PDF/X-4 file if the colorspace has been set
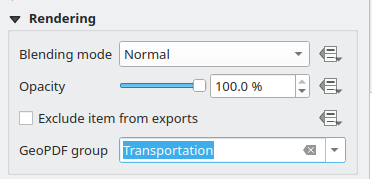
This new setting, located in the layout item "Rendering" section, allows users to set an optional "group name" for use in geospatial PDF exports. When set, a matching layer tree group will be created in the exported geospatial PDF and the item will only be visible when this group is checked.
This allows content to be selectively displayed as a group by viewers of the geospatial PDF. Eg, it can allow extra layout content such as descriptive labels or legends to only be shown when layers from the group are visible, making geospatial PDF export much more flexible.
This feature was funded by Rubicon Concierge Real Estate Services
This feature was developed by Nyall Dawson
A menu option to open Page Properties has been added to the main menu in the Print Layout interface.
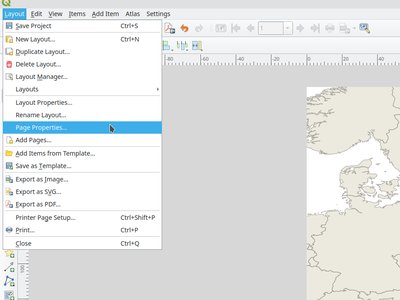
This feature was developed by Vedran Stojnović
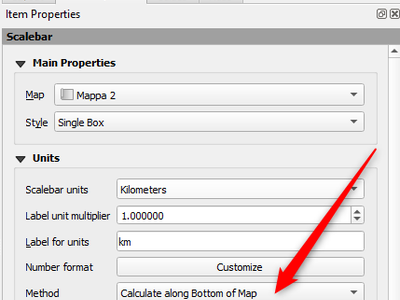
A new option for selecting a user-defined method of calculating the map scale in print layouts is provided. This exposes options for calculating scale:
- along the bottom of the map frame
- along the middle of the map frame
- along the top of the map frame
- as an average of all three measurements
By default, new scale bars will utilize the average method (instead of the previously used "along bottom" method), which will better handle scenarios where the scale at the top or bottom of the map cannot be calculated (e.g. when the top or bottom of the map falls outside valid areas for the map CRS).
This feature was developed by Nyall Dawson
Expressions
This numeric format allows users to craft a custom QGIS expression to format numbers. The expression can use the @value variable to retrieve the value to be formatted, and then use any standard QGIS expression function to format this as desired.
It can be used anywhere QgsNumericFormat is accepted, such as layout scalebars, elevation plots, layout tables, and color ramp legends
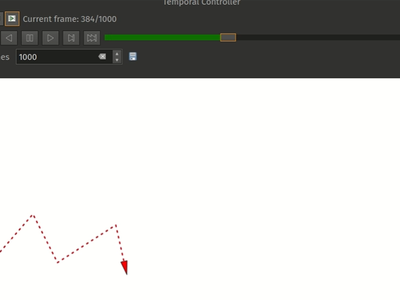
Two new functions are provided to the expression engine to work with M values along line strings:
line_interpolate_point_by_m: returns a point geometry of a matching m value interpolated along a line containing an m dimension.line_locate_m: returns a distance from the beginning of a line where a matching m value was found.
These functions are useful when working with temporal data (such as a linestring representing a GPS track, where the M value represents the epoch value), and can be used effectively alongside the temporal controller to create beautiful animations that were previously harder to unlock.
This feature was developed by Mathieu Pellerin
In line with QEP#283, new expression functions allow for the retrieval of colors that include:
- color_rgbf
- color_cmykf
- color_hsvf
- color_hslf
These functions differ from the existing color retrieval expression functions (e.g. color_rgb) by returning color values with different internal data types. This improves performance and fidelity by avoiding unnecessary color conversions in specific contexts, such as writing PDFs with native CMYK colors derived from expression values.
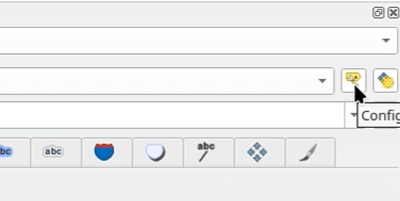
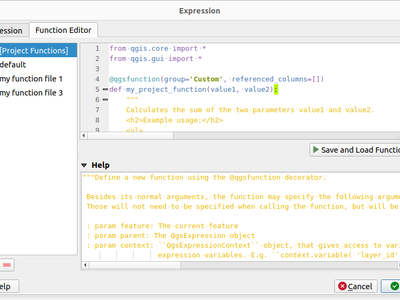
A new [Project Functions] element is now available within the expression builder dialog, allowing QGIS to store custom user-defined functions embedded in the project file.
This reduces the need to manually share Python code snippets and copy them to the user profile directory or import them into the expression builder dialog.
Project functions are unloaded when a project is closed, and user functions are reloaded to avoid any potential overwrite by activated project functions.
For security reasons, the handling of whether to load or not load these functions on project startup is configurable in the user settings with the same rationale used for managing project macros.
This feature was funded by the QGIS user group Switzerland
This feature was developed by Germán Carrillo
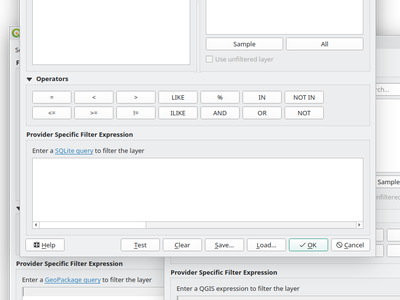
The query builder used for entering filter expressions on vector layers now shows the supported expression dialect.
In line with QEP#283, new expression functions provide support for setting project and ramp colors using CMYK color values using expressions
Digitising
A new advanced digitizing tool allows users to pick/ digitize a point at the intersection of two circles
To support this functionality, the QGIS API has been extended with a new abstract class for supporting similar "COGO" development in the future, as well as providing Python bindings for developing advanced digitization utilities and plugins.
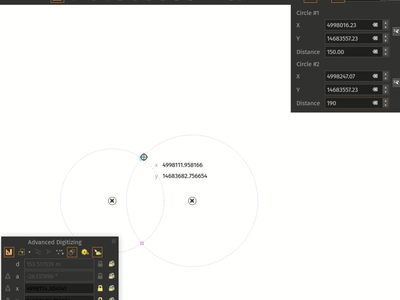
This feature was developed by Mathieu Pellerin
Visual construction guides have been added to the advanced digitizing dock widget, which builds on the existing CAD construction mode.
When recording construction guides, QGIS will render all construction steps taken as dashed lines which will remain visible for as long as advanced digitizing is enabled. The guides are snap-able, allowing for construction steps to begin mid-way into a previous set of steps too.
The construction guides are stored in a vector layer, which is exposed through the advanced digitizing dock widget, allowing for further customization of the guides via other application processes, such as Python plugins.
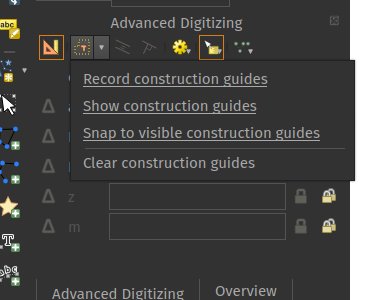
This feature was developed by Mathieu Pellerin
Data Management
VSI credential options are now exposed for user control when adding OGR vector/GDAL raster layers from the Data Source Manager, allowing users to define credentials on a per-layer basis for layers retrieved from cloud services (rather than use a single set of credentials for an entire QGIS session using an environment variable or similar approach).
Requires GDAL 3.5+
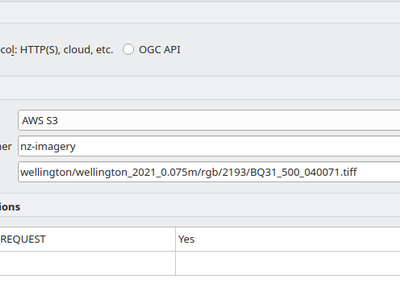
This feature was developed by Nyall Dawson
Forms and Widgets
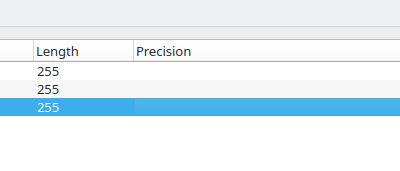
When creating a new vector layer, including scratch, shp, gpkg, and spatialite, users will now be able to reorder the field definitions.
While it was possible to add new widget wrappers for Processing parameters, it was not possible to override the standard widget wrappers defined for each parameter type.
A new parameter metadata setting for "widget_type" has been added, which provides developers to override the standard widget wrapper for a parameter for more control of application dialogues.
param.setMetadata( {'widget_wrapper': { 'widget_type': 'my_widget' }} )
This feature was developed by Alexander Bruy
Processing
A simple native algorithm has been added to allow for the opening of local files using the corresponding system programs, or URLs in a web browser.
Useful in combination with the Download File Algorithm to open the resulting file, or to display results after models triggering external systems.
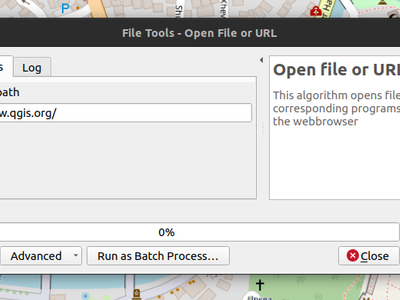
This feature was developed by signedav
Adds dedicated parameter types for Area and Volume values.
Modeled closely off the existing Distance parameter type.
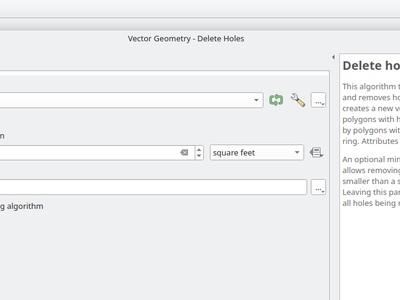
This feature was developed by Nyall Dawson
The GDAL Processing algorithm for vector information has been modified to support additional command-line parameters, and a new Vector information (JSON) algorithm is provided that will use the -json option of ogrinfo to create a JSON file output containing the layer or dataset information.
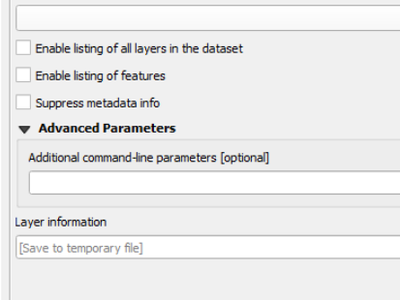
This feature was developed by Andrea Giudiceandrea
New 'Favorites' functionality has been added for Processing alogrithms, allowing users to statically pin their chosen algorithms to a dedicated section at the top of the toolbox for ease of access.
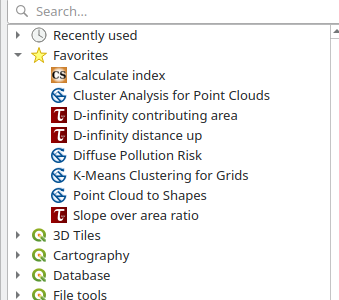
This feature was developed by Alexander Bruy
More raster creation options have been added to native Processing algorithms for more control of the output format (compression level, world file generation etc.). Affected algorithms include:
- Cell statistics
- Constant raster
- Export mesh
- Fill nodata
- Fuzzify raster
- Line density
- Random raster
- DTM filter (slope-based)
- Equal to frequency
- Raster boolean AND/OR
- Raster stack position
- Reclassify
- Rescale
- Round
This feature was developed by Alexander Bruy
Allows dragging and dropping layers from either the QGIS browser or file explorer onto any multiple-layer parameter panel. Handy when you have to add many layers and it's simpler to make a selection outside of the processing dialog.
This feature was developed by Nyall Dawson
Application and Project Options
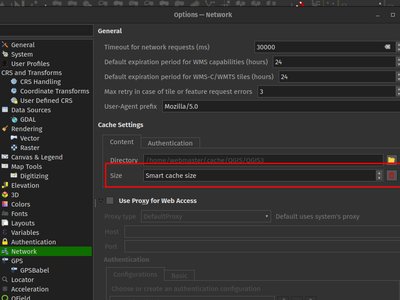
QGIS now has improved handling of its network disk cache by leveraging smart cache size logic currently utilized by modern web browsers.
This allows the cache to dynamically resize based on available storage space on the cache disk, and will result in most users getting a larger cache size (and improved network performance) by default as well as limiting loads to external providers and XYZ tile services.
Users can disable the smart cache size logic in favor of a static cache size using the updated Options dialog.
This feature was developed by Mathieu Pellerin
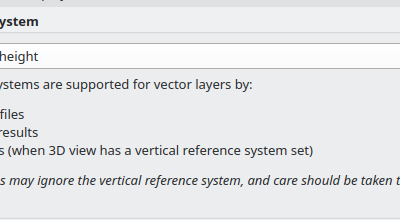
Vector layers can now include discrete settings for configuring the vertical reference system.
Application behavior for the definition of vertical reference on a layer will follow the same behavior as the project settings, namely:
- If the layer has a 3D CRS set, then the widget is disabled with an explanatory note
- If the layer has a 2D CRS set, then the user can select the appropriate vertical CRS
An explanatory note is included which details the facets of the application where the vertical CRS settings are respected, along with a warning for users to note that plugins and other tools may not respect the layers' vertical CRS configuration.
This feature was developed by Nyall Dawson
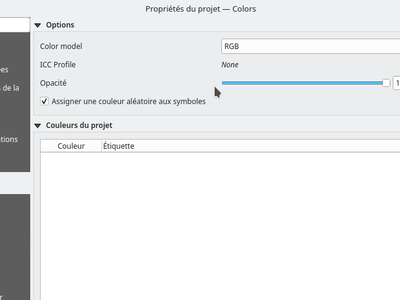
Project properties configuration widgets have been added for managing color modes and color profiles at the project level.
When loading an ICC profile, QGIS will enforce consistency between the color model and color space.
The ICC profile widget part is not visible unless QGIS is built with Qt 6.8.0 or greater
Profile Plots
A "Change Profile Name" menu item in the Options sub-menu of the Elevation Profile widget has been added that allows the user to change the name of the profile window.
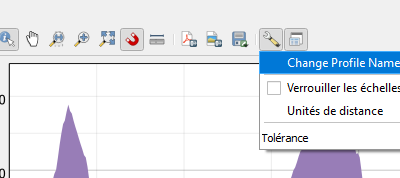
This feature was developed by Simon
When the map and/or layer has a vertical reference (3D CRS) configured it will be respected within profile plots
This feature was developed by Nyall Dawson
Browser
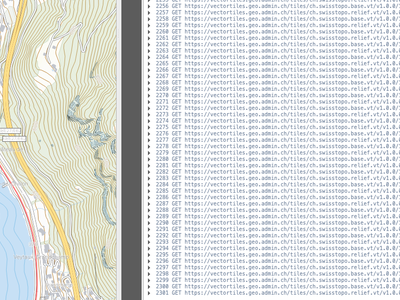
If a tile vector layer is created with a style URL but not source, the style is fetched and sources are extracted from it.
Here is a demo with a layer having two sources: https://vectortiles.geo.admin.ch/styles/ch.swisstopo.lightbasemap.vt/style.json
https://github.com/user-attachments/assets/948db86c-e79f-40cd-9060-6bc84a31fc2a
This feature was developed by Denis Rouzaud
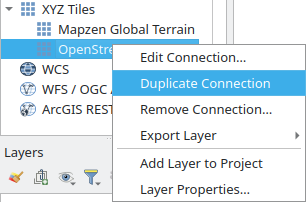
QGIS now includes a "Duplicate connection" action in the context menu of Browser connection items. This allows users to quickly make a copy of a connection to the same data source when only a few details differ (for example, a different PostGIS database on the same server).
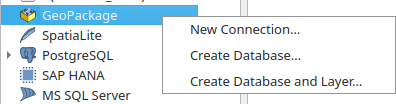
In previous versions of QGIS, creating a new SpatiaLite database with this action would create an empty database and add a new connection to the browser, while the same action executed for GeoPackage files would generate a database with a layer.
New actions for "Create Database" and "Create Database and Layer" have been added for more explicit and consistent database creation options.
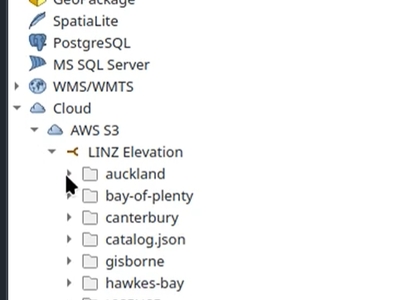
QGIS now natively supports the storing and browsing cloud storage connections within the QGIS browser panel. GDAL supported vector and raster data sources can be loaded directly from cloud providers and all GDAL VSI cloud handlers are supported including (S3, Azure, Google Drive, etc.)
Connections can also be created, modified, removed, and exported/imported to/from XML files.
This feature was developed by Nyall Dawson
Part one of the QEP300 implementation has been completed, allowing users to handle STAC catalogs and elements natively within QGIS using the browser.
A new STAC entry on the browser allows users to connect to static catalogs and STAC API endpoints.
STAC Items that contain cloud-optimized assets (e.g. COG, COPC, EPT) can be added as map layers via the drag-and-drop action.
A Download Assets dialog is provided in the STAC context menu that allows saving items to local storage.
All Catalog, Collection, and Item properties can be examined using the STAC Object Details dialog.
This feature was developed by Stefanos Natsis
Data Providers
QGIS now supports the POLYHEDRALSURFACE and TIN simple features by introducing new geometry types for QgsPolyhedralSurface and QgsTriangulatedSurface:
QgsPolyhedralSurfaceinherits fromQgsSurfaceQgsTriangulatedSurfaceinherits fromQgsPolyhedralSurfaceas a special case which only contains triangles.
This functionality removes the need for previously used workarounds, such as: - TIN is now the multipart of a triangle - There is no need to convert a polyhedral surface or a TIN to a multipolygon when importing these data types from PostGIS.
QGIS Server
Implemented to service #55317, layers now have an additional WFS Title server metadata property to allow users to differentiate between different layer collections on layers served via WFS with QGIS Server.
This feature was developed by Jürgen Fischer
Programmability
A QgsCsException is now raised when errors occur within QgsDistanceArea methods to prevent misleading analysis results and properly handle error propagation throughout the application
This feature was developed by Nyall Dawson
Developed in partial fulfillment of QEP 227, QGIS now includes a new as_numpy method on QgsRasterLayer objects in PyQGIS which allow for the easy conversion of a raster layer to NumPy array for improved integration processes and improved analysis of raster data using NumPy (Note that the NumPy library is an optional dependency not shipped with the QGIS Application).
This feature was developed by Till Frankenbach
Developed in partial fulfillment of QEP 227, QGIS now includes as_numpy and as_shapely methods on QgsGeometry objects in PyQGIS which allow for the easy conversion of a geometry to a (list of) NumPy array(s) or Shapely object(s) for improved integration processes (Note that the relevant libraries are optional dependencies not shipped with the QGIS Application).
This feature was developed by Till Frankenbach
Notable Fixes
Bug Title | URL issues.qgis.org (if reported) | URL Commit (Github) | 3.34 backport commit (GitHub) -- | -- | -- | -- Export of geopackage to File Geodatabase creates fid type real causing subsequent vector conversions to fail | #58690 | PR #58705 | N/A In QGIS 3.38.2 when deleting an attribute from a gdb file, all the fields in the remaining attributes get deleted as well | #58669 | PR #58733 | PR #58769 test_provider_ogr.py: do not alter source test data, to keep 'git status' clean | Unreported | PR #58734 | N/A GeoJSON: edits are not saved | #58261 | GDAL PR 10794 | N/A GeoJSON: edits are not saved | #58261 | PR #58740 | N/A In Qgis 3.34.4 Saving vector Temporary Scratch Layer as GeoJSON - Newline Delimited leads to Unavailable Layer! error. | #58760 | PR #58768 | PR #58771 parquet file exported from QGIS causes crash when loaded into a project | #58086 | GDAL PR 10815 | N/A In Qgis 3.34.4 / 3.38.3 vector layer saved as KML does not allow deleting of polygon features | #58780 | GDAL PR 10840 | N/A Layer user notes only available for QgsVectorLayer when reading a project with flag QgsProject.FlagDontResolveLayers | #58818 | PR #58835 | N/A QgsJsonExporter layer field with ValueMap | #58861 | PR #58864 | N/A Geospatial PDF Export for Rasters does NOT work | #58891 | PR #58895 | PR #58903 QGIS not recognizing CRS "EPSG:3301 - Estonian Coordinate System of 1997" in MapInfo mid/mif and tab formats | #58283 | GDAL PR 10920 | N/A Don't use the The Word Which Must Not Be Used | Unreported (well, through hostile channels) | PR #59017 | N/A In Qgis 3.34.4 / 3.38.3 vector layer saved as KML does not allow deleting of polygon features | #58780 | GDAL PR 10991 | N/A [BUGFIX] [PostgreSQL] Properly take into account 'name' type | Unreported | PR #59147 | TODO
This feature was funded by QGIS.ORG (through donations and sustaining memberships)
This feature was developed by Even Rouault (Spatialys)
Bug Title | URL issues.qgis.org (if reported) | URL Commit (Github) | 3.34 backport commit (GitHub) -- | -- | -- | -- QGIS Server filter does not work as expected for intersection filters | #58220 | Cannot reproduce | [Layout] Missing atlas layer attributes in expression "Fields and Values" group for fixed table item | #58774 | PR #58778 | No Clearing the default value expression cannot be canceled / undone | #58767 | PR #58787 | No PostgreSQL authentification get back to basic if a layer is opened with "execute SQL" from qgis explorer panel | #58784 | Cannot reproduce | QGIS Server: fixed width of 200 px of cascaded WMS layer legends | #57422 | PR #58790 | No Random Points in Polygons behaves unexpectedly | #58737 | PR #58815 | No When using a computed or virtual field that refers to other layers's fields having the same name, the wrong value is returned. | #49469 | PR #58819 | TODO qgis can't search for postgis elsewhere than in the public schema | #58577 | Not a bug (closed by OP) | Advanced digitizing using meters instead of ft if ft are set as default unit | #58620 | PR #58844 | queued In layer Filter "lower" function not working with driacritrical marks | #58893 | Cannot reproduce | Delete expression in Default value + click on another field in the attribute form manager = Crash | #58887 | PR #58911 | N/A Deleting "all other values" breaks categorise symbology | #58875 | PR #58916 | queued SLD, Server - Service=WMS&Request=GetStyles: LabelPlacement/Displacement malfunction | #58862 | PR #58945 | queued Creating table on MSSQL sets varchar and nvarchar column lengths as 1 regardless of UI input | #58809 | PR #58955 | queued Unwanted unique constraint added when exporting to geopackage, if not null constraint is applied via default style | #58431 | PR #58986 | Risky? Georeferencer is not using locale in GCP table | #58765 | PR #59025 | queued Basic editing using "Automatic Transaction Groups" generates a critical error | #58845 | PR #59076 | queued
This feature was funded by QGIS.ORG (through donations and sustaining memberships)
This feature was developed by Alessandro Pasotti (itOpen / qcooperative)
Bug Title | URL issues.qgis.org (if reported) | URL Commit (Github) | 3.34 backport commit (GitHub) -- | -- | -- | -- Repeated Crash when using Reshape Feature Tool | #57225 | PR #58779 | PR #58792 pyqt5_to_pyqt6.py fails on infinite recursion | #58659 | PR #58785 | No Legend in map atlas anchored to bottom left or bottom right will not correctly reposition in PDF | #37566 (Regression) | PR #58798 | PR #58920 Calling several times waitForFinished on task would cause a deadlock | Unreported | PR #58799 | No Debian sid Qt6 compile fails on sip build, python bindings | #57760 | Now working with updated debian |
This feature was funded by QGIS.ORG (through donations and sustaining memberships)
This feature was developed by Julien Cabieces (Oslandia)
Bug Title | URL issues.qgis.org (if reported) | URL Commit (Github) | 3.34 backport commit (GitHub) -- | -- | -- | -- Fix rendering of line direction symbols in labels, cleanup label rendering code a bit | #59107 | PR #59114 | N/A [gps] Be tolerant to talker IDs which don't start with 'G' | Reported privately | PR #59124 | N/A Fix unsafe use of QgsProject::instance from vector layer classes | Unreported | PR #59118 | Too risky When excluding tests, only exclude exact matches | Unreported | PR #59116 | N/A Many cppcheck fixes to get CI green again | When layout scalebar settings are invalid, show warning message | Unreported | PR #59088 | N/A Mark all bool operators as explicit, associated fixes | PR #59086 | N/A Fix random crashes | #36125 | PR #59080 | PR #59087 Optimise grid decoration rendering | Reported privately | PR #59044 | N/A Optimise text rendering for a common scenario | Reported privately | PR #59037 | N/A Don't override cursor in pin labels map tool | #59016 | PR #59033 | PR #59035 Fix hang when searching expressions using regular expressions | #59002 | PR #59019 | N/A Fix aggregate function returns incorrect results | #58221 | PR #59000 | PR #59085 Fix slow performance with layout table filtering with atlas point geom filter | #58274 | PR #58999 | PR #59030 Add user-friendly warnings when built without webkit and opening layouts with html items | #58975 | PR #58997 | N/A Fix edit/copy/paste symbol action for layers with inverted polygon renderer | #55426 | PR #58967 | PR #59034 Non-default blend mode should force raster render of layer | #55629 | PR #58966 | PR #59036 Only render main annotation layer in main map canvas or docked maps | #58766 | PR #58964 | N/A Regenerate primary key when making layer permanent if layer property set | #58942 | PR #58954 | N/A QgsMapLayer::setDataSource don't require layer name, provider | Unreported | PR #58953 | N/A Fix incompatibility between text wrapping and HTML text formatting | Unreported | PR #58952 | N/A Fix use of custom object values from QGIS expressions in virtual layers | #58644 | PR #58939 | N/A [processing] Fix translation of elapsed strings | #58635 | PR #58928 | N/A Fix deadlock when exporting atlas with legend via PyQGIS | #58496 | PR #58927 | PR #58969 Fix clipped render when using geometry generator symbol in layout items | #58909 | PR #58926 | N/A Show warning in help for algorithms for known issues or security risk | Reported privately | PR #58925 | N/A [processing] Replace format for saving batch processing parameters | Reported privately | PR #58923 | N/A Fix missing canvas variables in some expression editors | Unreported | PR #58907 | PR #58934 Don't restore corrupted sizes/positions when restoring layout items | #55240 | PR #58906 | PR #59103 Add scale method option for layout scale bars | #55240 | PR #58904 | N/A Avoid layout scalebar resizing to huge widths in extreme situations | #55240 | PR #58794 | N/A QgsDistanceArea methods should raise QgsCsException when errors occur | Unreported | PR #58795 | N/A Don't apply reset-to-zero step size logic in spin boxes when no special value text is set | Unreported | PR #58836 | N/A
This feature was funded by QGIS.ORG (through donations and sustaining memberships)
This feature was developed by Nyall Dawson (North Road)
Bug Title | URL issues.qgis.org (if reported) | URL Commit (Github) | 3.34 backport commit (GitHub) -- | -- | -- | -- 2-Circle Point Intersection coordinate precision problem | #59039 | PR #59155 | N/A Advanced Digitizing Split Tool zeroes M values in a PolyLineZ shapefile | #49971 | Do no fix (GEOS issue with M) | QGIS tools splitting curved polygons | #57021 | Do no fix (GEOS issue with Curve support) | Incorrect winding/orientation/order of polygon's vertices in Memory layers | #58333 | PR #59156 | Too risky ?
This feature was funded by QGIS.ORG (through donations and sustaining memberships)
This feature was developed by Loïc Bartoletti (Oslandia)
Bug Title | URL issues.qgis.org (if reported) | URL Commit (Github) | 3.34 backport commit (GitHub) -- | -- | -- | -- Layer order change does not update the 3d view | #51291 | PR #59026 | PR #59187 Unwanted vertices when tracing | #52935 | PR #59055 | N/A Extra vertices form to all layers when using tracing | #59041 | PR #59055 | N/A QGIS drops extra byte fields from laz (char and unsigned char) | #56945 | PR #59160 | N/A 3D view - completely flat MultiPolygonZ geometries don't show color correctly | #52832 | pending | Adding more than 250 files or a folder with many files and the Build virtual point cloud (VPC) Tool Fails | #58894 | PR #59200 |
This feature was funded by QGIS.ORG (through donations and sustaining memberships)
This feature was developed by Stefanos Natsis (LutraConsulting)
Bug Title | URL issues.qgis.org (if reported) | URL Commit (Github) | 3.34 backport commit (GitHub) -- | -- | -- | -- Fix use of QgsReferencedGeometry in expressions | Unreported | PR #59180
This feature was funded by QGIS.ORG (through donations and sustaining memberships)
This feature was developed by Jacky Volpes (Oslandia)
Bug Title | URL issues.qgis.org (if reported) | URL Commit (Github) | 3.34 backport commit (GitHub) -- | -- | -- | -- Clipping of long WKT strings for geometry parameters by using our geometry widget | Unreported | PR #59209 | N/A Open Sans font installation failed | #58988 | PR #59142 | PR #59152 Print Layout: with a rotated map, turning on Controlled by Atlas (atlasScalingMode = Auto by default) hangs Layout Manager and corrupts project file | #58245 | PR #58749 | N/A Additional NoData value not stored correctly in Raster Layer Properties | #58293 | PR #58748 | PR #58751 Do not copy a geometry column from non-geometry layers | #58725 | PR #58746 | PR #58752 Attribute table: crash and weird behavior when a field has an empty name | #58738 | PR #58745 | PR #58757 Bad styling of scrollbars in the plugin manager dialog | Unreported | PR #58713 | PR #58721 "Refresh layer at interval" settings are not saved to QML | #58656 | PR #58686 | PR #58714 Unresponsive "Add record" button in non-geometry layer editing | #55092 | PR #58680 | PR #58710 -- | PR #58747 | -- | -- Algorithms having an output directory parameter fail to execute if output directory is set to "Save to temporary folder" | #58345 | PR #58619 | PR #58626 Text in message box 'Font Install Failed' is poorly legible in Night Mapping theme | #57290 | PR #58618 | PR #58628 Bad plugin manager's look on dark themes | Unreported | PR #58606 | -- Decorations are too small when exporting temporal controller images on Mac | #58469 | PR #58605 | PR #58613 Layer with data defined symbology does not appear when QGIS opened | #58508 | PR #58603 | PR #58615 QGIS (3.38.1) crashes when trying to show layer labels. QGIS died on signal 11. | #58570 | PR #58602 | N/A Fix layout map item preview rendering of XYZ layers with known tile DPI | Unreported | PR #58543 | PR #58566
This feature was funded by QGIS.ORG (through donations and sustaining memberships)
This feature was developed by Mathieu Pellerin (OPENGIS)
Bug Title | URL issues.qgis.org (if reported) | URL Commit (Github) | 3.34 backport commit (GitHub) -- | -- | -- | -- Remaning rubberband and plot data after clearing profile tool | #50766 | PR #59181 | N/A Fix issue with vertical lines not visible in the elevation profile tool | unreported | PR #58959 | N/A
This feature was funded by QGIS.ORG (through donations and sustaining memberships)
This feature was developed by Jean Felder (Oslandia)