Project: QGIS
Version: 3.44
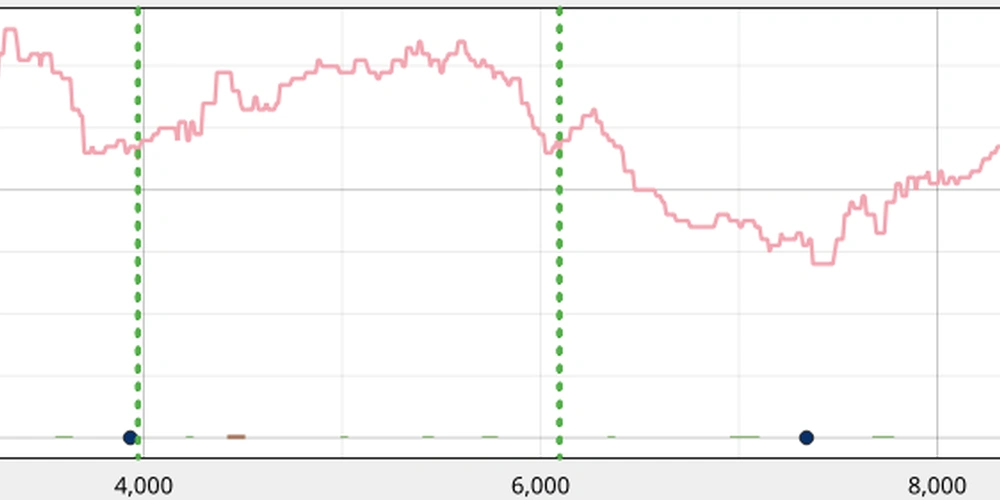
Profile plots now support the display of subsection indicators, which are rendered as vertical lines in the profile tool. This is based on outcomes from QEP#260 and supports custom indicator symbology as well as providing subsection indicators on both the Elevation Profile view and Print Layout elements.