Project: QGIS
Version: 3.26
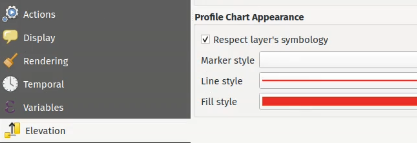
Vector layers added to profile charts will default to respecting their layer symbology. A checkbox has been added to disable this in the layer elevation properties.
This means that vector results in elevation profile charts will default to showing features using their corresponding 2D renderer, so custom styles such as categorized classes will be visible on the profile chart by default.
There's also options to change the interpretation of the elevation profile for vector layers. By default, the elevation profile tool will use an "individual features" option, which samples discrete positions where the cross section profile line intersects the vector features. There's also a "continuous surface" option which will generate an interpretation of the surface by interpolating across the sample positions for enhanced visualization, such as the production of a continuous surface line from contour lines or surveyed elevation points.
Additional rendering capabilities are provided for the "continuous surface" interpretation option, such as a "fill below" symbol style. This can be easier to interpret in some cases, and helps match expected symbology conventions in certain disciplines.
This feature was funded by Crowdfunding for raster and point clouds improvements
This feature was developed by Nyall Dawson (North Road Consulting)