Project: QGIS
Version: 3.26
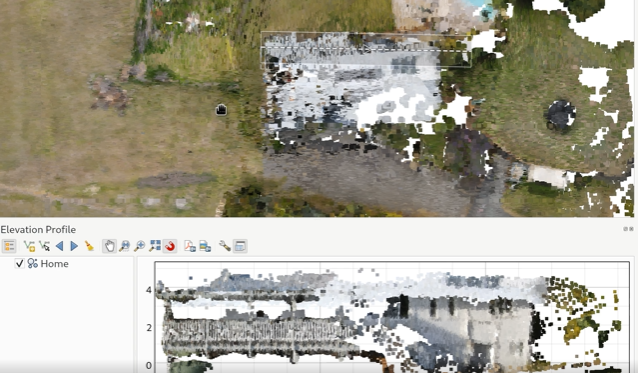
Point cloud layers in profile charts include the following symbology features
- Single color display of points or a setting to inherit classification and coloring from the 2D symbology (e.g. RGB colors)
- Respecting the profile curve distance tolerance setting
- Option to reduce the opacity of points which are further from the profile curve
- Automatic refinement based on plot visible area and scale, with a user controllable max screen error
- Control over appearance of points (color, size and shape)
This feature was funded by Crowdfunding for raster and point clouds improvements
This feature was developed by Nyall Dawson (North Road Consulting)