Project: QGIS
Version: 3.16
Modification of the QgsRuntimeProfiler class which performs the following functions:
1. Make the profiling thread-safe, so that it's possible to record times across multiple threads
2. Allows different profiling "groups"
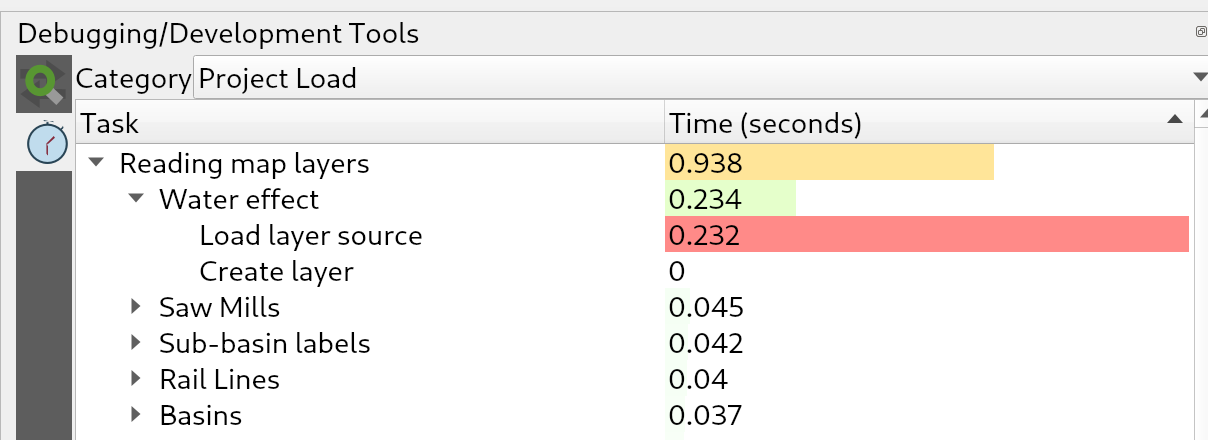
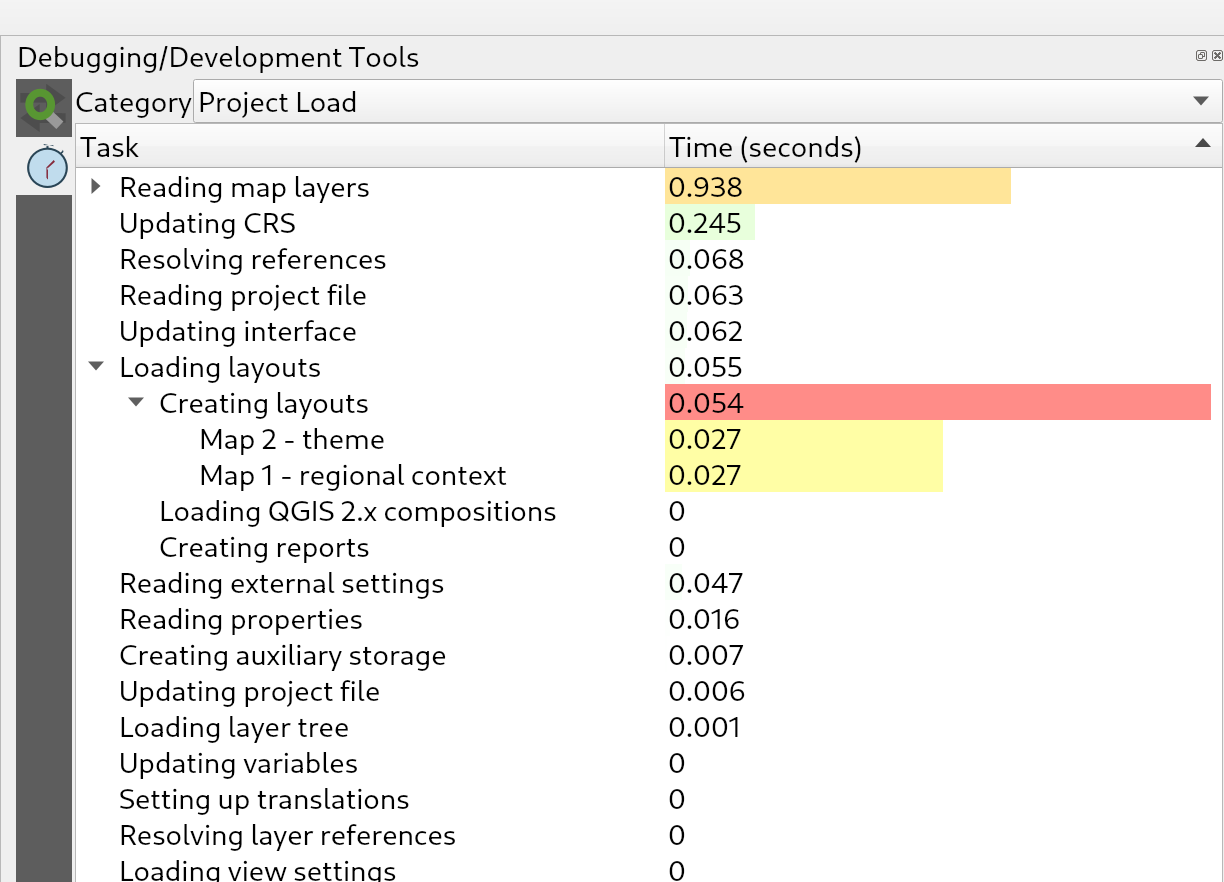
The new groups API is used here to expose a breakdown of project load times in the debugging dock, alongside the existing QGIS startup profiling. It's possible now to get a breakdown of the various stages of project load, in order to identify the causes of slow project load times.
TODO:
In the majority of cases, performance problems will be caused by one or more layers, so it would be nice to further break down the individual layer load times. For example, for an individual WFS layer, we may see the time taken for the initial "server capabilities" or other queries.
Add a group with profile times for map rendering, so you can see exactly which layers in your project are causing slow map redraw times.
In its current form, only the overall load time of each individual layer is displayed.
This feature was developed by Nyall Dawson