

Heat maps in Context
“Heat map visualizes hotspots in the distribution of features on the map i.e. dense areas will be highlighted in a heat map, based on the parameters you use for processing it”
In this module, we explore heat maps as a point symbolisation technique.
You try:
Goal: To learn creating heat maps as a symbolisation technique
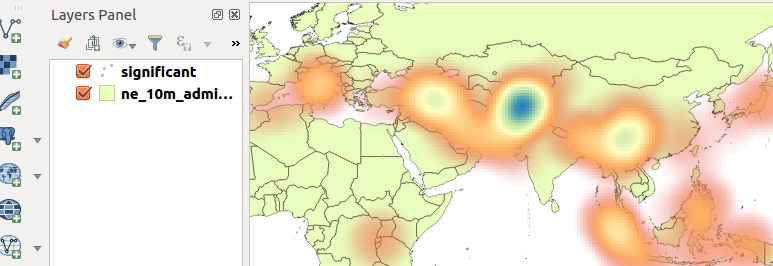
Data: heatmaps/earthquake.csv and ne_10m_admin_0_countries from heatmaps/ne.sqlite.
- Load the earthquake layer as a spatial layer.
- Load the ne_10m_admin layer
- Change the country layer transparency as specified
- Change the layer order to put the point layer on top
- Open the properties of the point layer and click the style tab.
- Change to the specified render type
- Choose the specified colour ramp
- Apply the changes and observer the map
- Why does the whole map colour change?
- Edit the colour ramp. Make colour 1 transparent.
- Apply the changes and observer.
- Open the properties of the point layer and change rendering quality to fastest. Observe the changes.
- Change the weight points by option to use the specified attribute.
NB: What can you infer about the intensity of the heat map in relation to deaths?
| Name | Expectation |
|---|---|
Render ❗ |
Heat map |
Country transparency ❗ |
70 |
Colour ramps ❗ |
Spectral |
Attribute ❗ |
Deaths |
More about
Heat maps use colour to communicate relationships between data values that would be difficult to understand if presented numerically in a spreadsheet or attribute table. A colour ramp helps to visualise a heat map with low values having colours at the bottom of the colour ramp and high intensity values corresponding to darker values on the colour ramp.

Check your knowledge:
-
When would it be useful to use a colour ramp:❗
- To depict how a player was behaving during a soccer match.
- To show that the layer being represented is a vector layer.
- Heat maps can also be applied to raster data.
-
Which statement is false:❗
- A colour ramp is used to show variation in a phenomena of interest
- Heat maps are extensively used by scientist
- Heat map points can be weighted by a discrete column
-
A colour ramp is a type of vector analysis:❗
- True
- False

Further reading:
-
Plugins_heatmap: http://docs.qgis.org/2.14/en/docs/user_manual/plugins/plugins_heatmap.html ❗
-
Heat-map-using-qgis: http://grindgis.com/software/heat-map-using-qgis ❗
Download the sample data for the lesson.